Square price to time, from one swing.
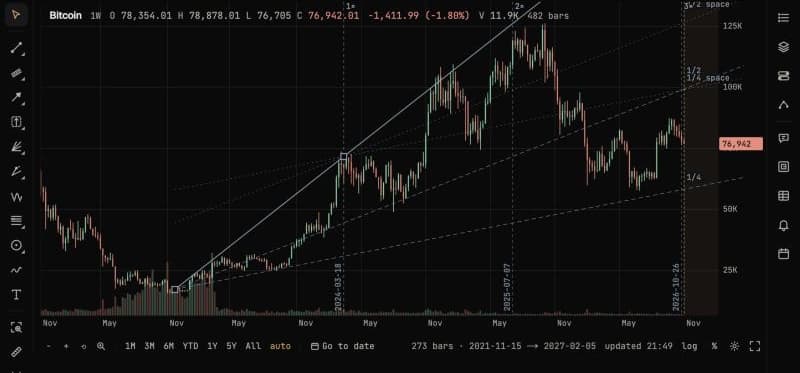
Constructions that take the size of a swing in price and turn it into time, and back: angles, arcs, a ladder of intervals, a mirror of the move before, and an equal second leg. They measure what a swing implies if the market keeps its proportions.
Price–time angles · Arc · Three-point arc · Time conversion bar · Natural ratio · Interval ladder · Mirror · ABC symmetry
Who it's for
Traders who measure swings against each other, in price and in time, and want the arithmetic done and the dates written on the chart.
What you'll see
Angles squared to your swing, arcs carried forward, levels at musical intervals from a tonic, a faint ghost of the move before a pivot, and where an equal second leg would end.
Good to know
These tools haven't been through a published test like the Gann tools, so we make no claim that they find turns. Where several land on one date, that agreement counts the tools you drew, not evidence.
What it helps you do
- 01
Square a swing in one click
Press Last major swing in the Price–Time panel to lay out angles, an arc and the year counts from the most recent large swing, or use your own selection.
- 02
Build an interval ladder
Pick a major high or low as the tonic and read the levels a scale's intervals above and below it, in every octave.
- 03
Compare the move after with the move before
Drop a mirror on a pivot to fold the bars before it forward, or ABC symmetry to see where an equal second leg ends in price and time.
Part of PyraTime Pro
Anyone can open a chart without an account. Signing in starts a fourteen-day trial of everything. After that, the free plan keeps the chart and the core tools, and Pro is €19.99 a month or €199 a year.
- Pro
- Price–time angles, Arc, Three-point arc, Time conversion bar, Natural ratio, Interval ladder, Mirror, ABC symmetry
- Trial
- All of it, for fourteen days from signing in
Questions
01How is this different from the Gann tools?
The Gann tools measure from a turn at a set scale of price per unit of time. These start from a swing you choose and square its own price range to its own length, so every level and date comes from that move.
02Do these tools find turning points?
We make no claim that they do: they haven't had a published test. Select any drawing and run Test to score it against the same drawing placed elsewhere on your chart.
03Can I try them without paying?
Yes. Signing in starts a fourteen-day trial of everything, Price–Time included. After that it comes with Pro, at €19.99 a month or €199 a year.
Try Price–Time on a real chart
The link opens Studio with Price–Time on. Signing in starts the fourteen-day trial, which unlocks it.