Price–time geometry
Tools that measure a swing and carry its proportions forward: angles squared to the first leg, arcs swung from a low, ratios stacked into levels, and the past folded onto the future. What each draws, and how to read them together.
PyraTime7 min readUpdated November 2026
01What it's for
Where the Gann tools start from a fixed scale, the price–time tools take their scale from the market itself. You mark one swing, usually a major low and the first strong high after it, and the tools use that swing's size and length to draw angles, curves, levels and dates further on.
The idea is proportion: if a market's first leg took a certain amount of price and time, later moves can be measured in the same units. Each tool is a different way of carrying that unit forward, and the interesting places are where several of them meet.
02The tools, and what each draws
- Price–time angles
- Angles squared to a swing. Click a major low, then its first top (or a high, then its first low).
- Arc
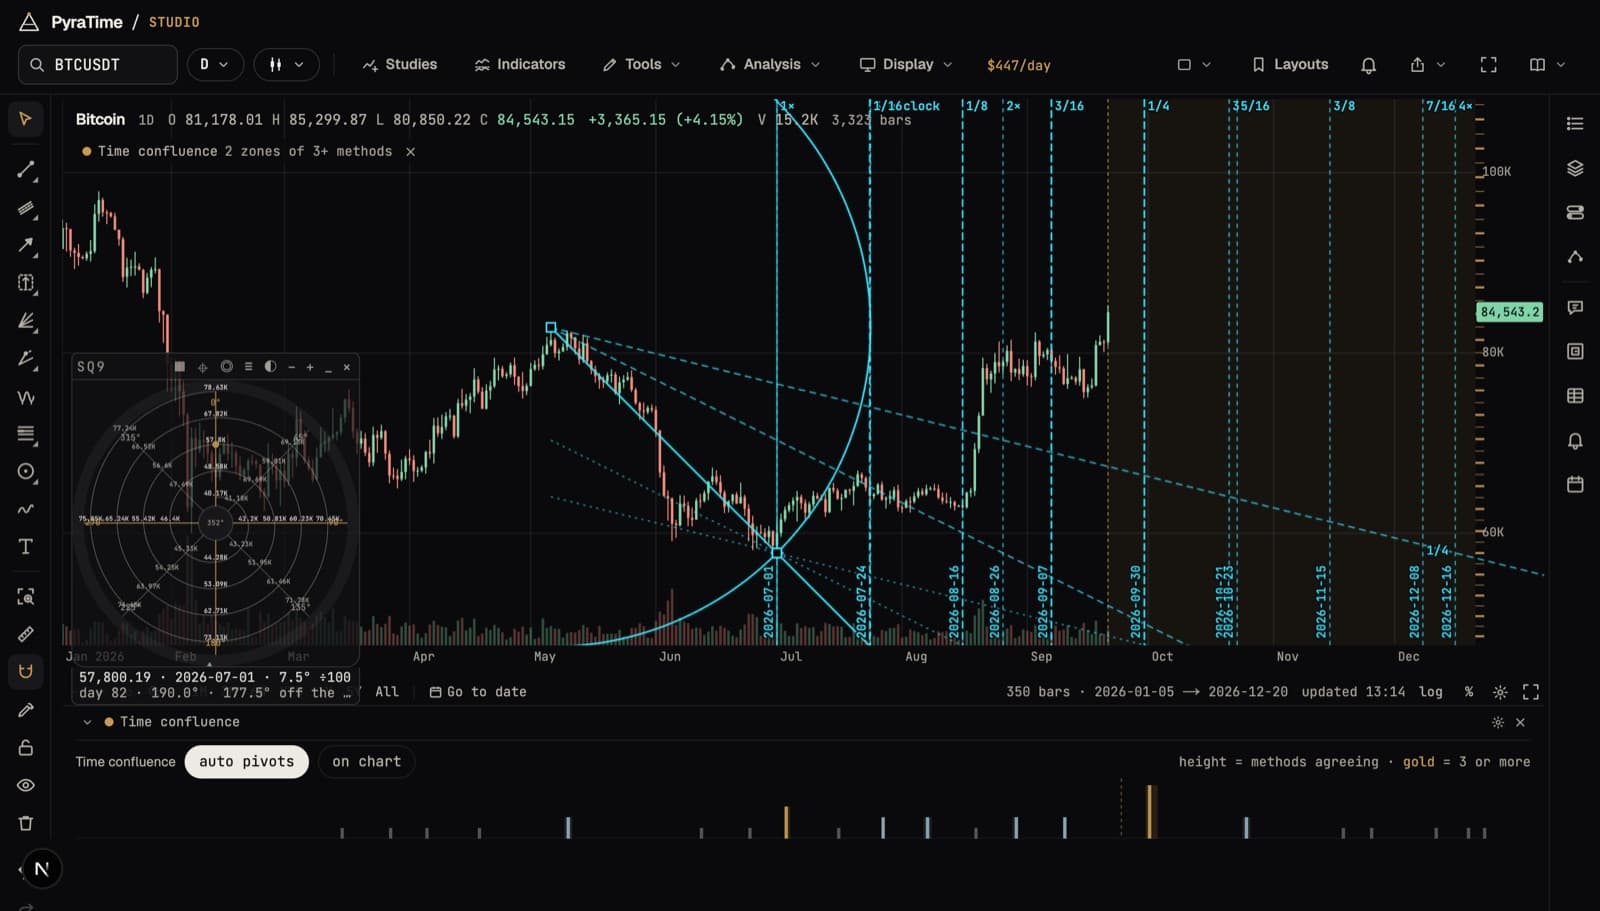
- A circle swung from the major low through the first impulse high, carried forward as arcs. Price is locked to time first, so the circle stays round.
- Three-point arc
- A curve through three pivots you click, for moves that bend rather than run straight.
- Time conversion bar
- Turns a swing's price range into days, using the 1×1 from another swing.
- Natural ratio
- Divides the first impulse's high by its low and repeats that ratio up and down the chart as levels.
- Interval ladder
- From one major high or low, the tonic, lays out levels at the intervals of a musical scale in every octave above and below it.
- Mirror
- Folds the bars before a pivot forward as a faint ghost, to compare the move after with the move before.
- ABC symmetry
- From a move's start, the end of its first leg and the pullback, projects where an equal second leg would end in price and time.
- Three-pivot convergence
- Counts 144, 55 and 90 bars forward from two major swings and a pivot between them, and marks the zone where the three counts land together.
- Range square
- From a swing low and high, turns the range into time: divisions, levels and dates projected forward from the swing.
03What our tests found
These tools haven't been through a published test of the kind we ran on the Gann fan, box and time counts, so we make no claim that they find turns. Treat them as measurement: they say what a swing implies if the market keeps its proportions, not that it will.
Where several tools land on the same date, Studio's time-confluence strip shows how many agree. Agreement is easy to manufacture, though: draw enough tools from enough swings and some will always line up. The strip counts the tools you drew, not evidence.
When a level or date matters to you, select the drawing and run Test. It scores the drawing against the same drawing placed elsewhere on the chart, leaves out the turns it was placed on, and adds the result to your Claims, where every test you run raises the bar for the next.
04Using the Price–Time tools in Studio
- 01Open a chart, then open the Price–Time panel from the sidebar.
- 02Press Last major swing to lay out the angles, arc and year counts from the most recent large swing, or select your own two-point drawing and press Use selected.
- 03Add other tools from the drawing rail: price–time angles (⌥J), the arc (⌥O), the interval ladder or the mirror.
- 04Read the panel's 90-day rule and square-root calculator for the swing you chose.
- 05Select any drawing for its levels and dates, and run Test when you want a score.
Anyone can open a chart. Signing in starts a free fourteen-day trial of everything; after that, the free plan keeps the chart and the core tools, and the rest comes with PyraTime Pro.