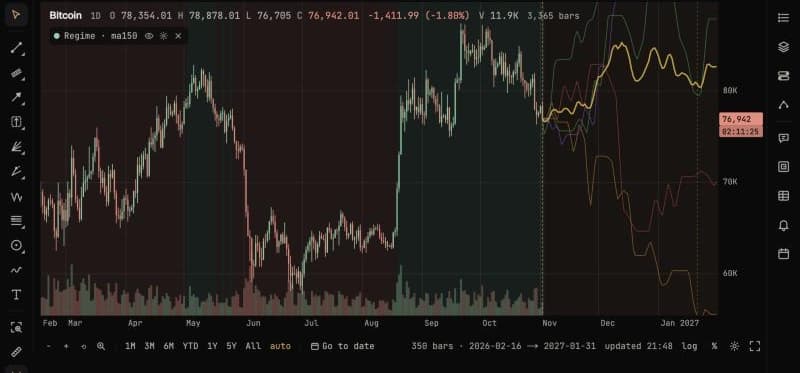
The market as a whole, with the spread shown.
Is it trending? Does another market move first? Which past stretch looked most like now, and what followed? Each tool answers with its spread or its test beside it, so you can see how sure the answer is.
Regime bands · Intermarket · Timing clusters · Analogues · Learned model · Echo line · Magnitude
Who it's for
Traders who want context around a chart: the trend it's in, what tends to move first, and what similar stretches did next, with the uncertainty left in.
What you'll see
Shaded trend regimes, markets tested as leaders, dates where your timing tools cluster, the paths that followed the most similar past windows, and forecast lines with their inputs.
Good to know
Regime rules describe the past well but scored no better than shuffled data, and no market reliably led the S&P 500 or Bitcoin. When analogue paths split both ways, that split is the answer.
What it helps you do
- 01
Shade the trend
Turn on Regime bands to see where the market trended up, down or sideways, by a moving-average or quadrant rule.
- 02
See what followed similar stretches
Analogues finds the past windows most like now and draws what came next, every path faintly, so the spread is as plain as the middle.
- 03
Test which markets lead
Intermarket tests indices, the dollar, yields, the VIX, oil, metals and crypto as leaders, choosing the lag on older data and grading it on newer.
Part of PyraTime Pro
Anyone can open a chart without an account. Signing in starts a fourteen-day trial of everything. After that, the free plan keeps the chart and the core tools, and Pro is €19.99 a month or €199 a year.
- Pro
- Regime bands, Intermarket, Timing clusters, Analogues, Learned model, Echo line, Magnitude
- Trial
- All of it, for fourteen days from signing in
Questions
01Are the forecast lines predictions?
No. They show what a method says, with its spread. In our tests, regime rules scored at or below shuffled data, and the analogue paths are drawn individually so you can see when they disagree.
02Which markets can lead another?
Intermarket tests twelve: indices, the dollar, yields, the VIX, oil, metals and crypto. It chooses the lag on older years and grades it on newer ones, so a lead found by chance usually fails the second part.
03Which timeframe should I use?
Daily bars. Regime bands, analogues and intermarket all read the daily history.
Try Patterns & Forecast on a real chart
The link opens Studio with Patterns & Forecast on. Signing in starts the fourteen-day trial, which unlocks it.