Patterns and forecasts
Tools that look at the market as a whole rather than one swing: is it trending, does another market lead it, which past stretch looked most like now, and what a line learned from your chosen inputs says next. What each one shows, and how far to trust it.
PyraTime8 min readUpdated November 2026
01What it's for
The pattern tools describe the market around a chart: whether it has been trending up, down or sideways, whether another market has tended to move first, and where several timing tools agree on a date.
The forecast tools go one step further and draw something ahead of the last bar: the paths that followed the most similar past stretches, or a line learned from inputs you pick. They are the tools most likely to be over-read, so each one shows its own spread or its own test.
02The tools, and what each draws
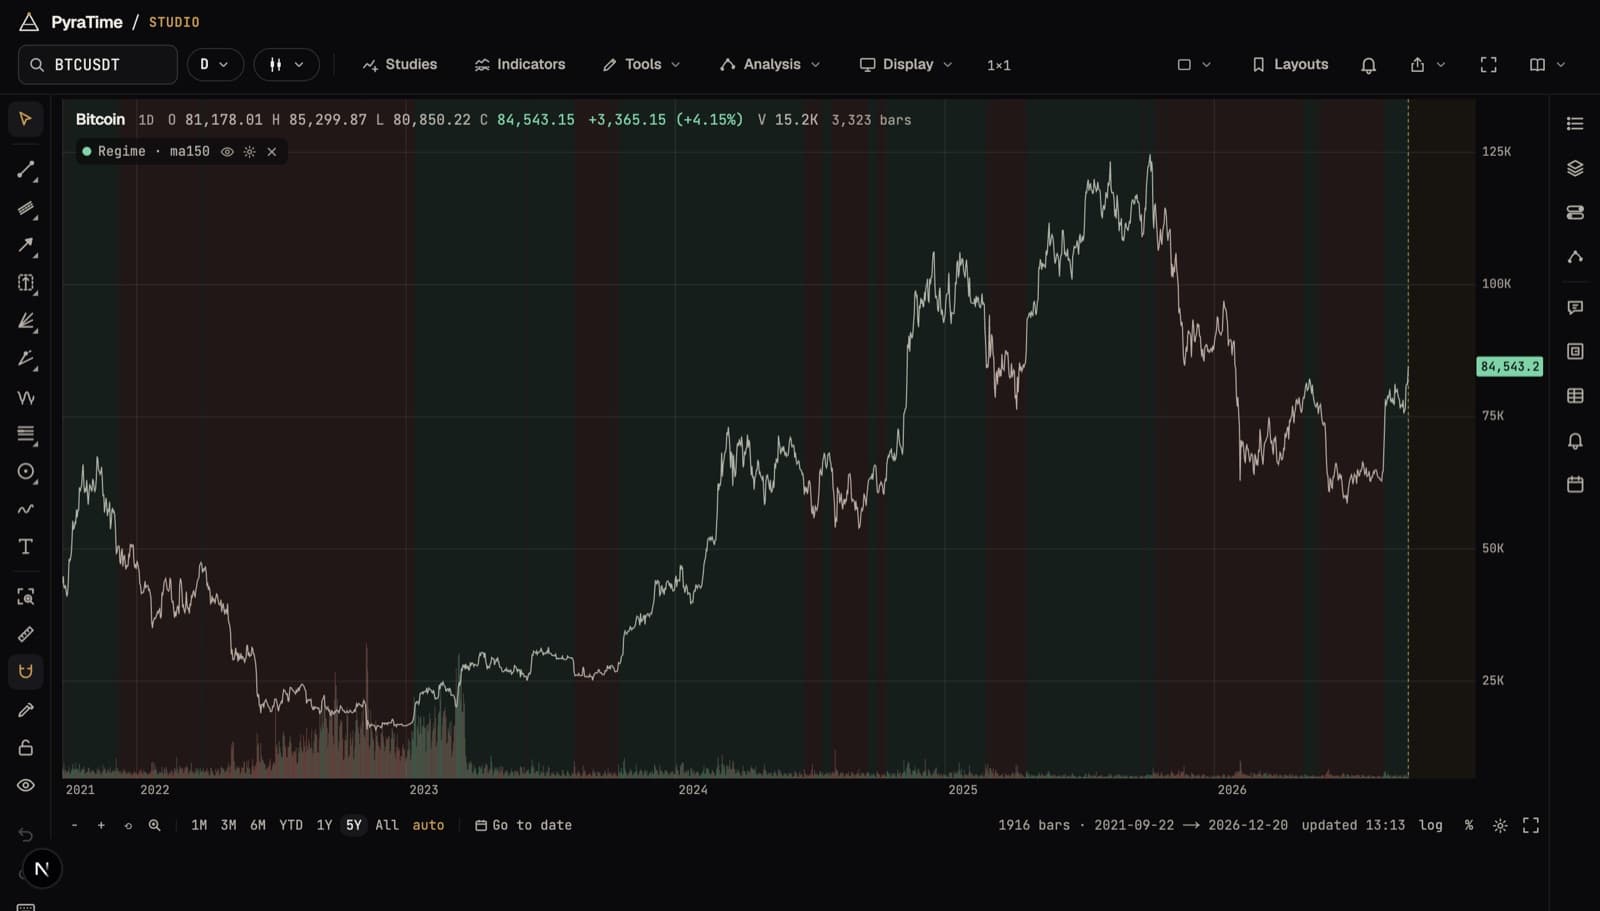
- Regime bands
- Shades the chart where the market trended up, down or sideways, by a moving-average or quadrant rule.
- Intermarket
- Tests other markets (indices, the dollar, yields, the VIX, oil, metals, crypto) as leaders of this one, choosing the lag on older data and grading it on newer.
- Timing clusters
- A strip of dates where several of your timing tools land together.
- Analogues
- Finds the past windows that looked most like now and draws what came next, every path faintly, so you see the spread as well as the middle.
- Learned model
- Learns a forecast line from inputs you choose, and shows how much each input mattered.
- Echo line and gold line
- Forecast paths built from the market's own past and from planetary cycles, drawn into the future zone.
- Magnitude
- Writes a 0–100 score for each day ahead, in a pane under the chart.
03What our tests found
Regime rules describe the past well, but that is not the same as knowing anything about the next month. We scored three common rules on the S&P 500, the Dow, SPY, gold and Bitcoin, against the same rules applied to shuffled versions of each market. Every one landed at or below that floor. A two-state statistical model did no better.
Used as a filter, in the market when the rule says up and out when it says down, the rules cost money against simply holding on the S&P 500, the Dow and gold. On Bitcoin, the 150-day rule cut the worst fall from 77% to 52%, and the 50-day rule raised the return for its risk, each clearing the usual 5% bar. Neither survived correcting for the number of rules and markets tried.
Of twelve markets tested as leaders, none led the S&P 500 or Bitcoin. Seven of the twelve changed sign between the years used to choose the lag and the years used to grade it, which is what a search through noise looks like. For gold, the ten-year yield and the VIX led by one session and survived the correction, but the effect is small and a day wide.
Analogues and forecast lines are drawn with their spread, and each can be tested. When the paths split both ways, that split is the answer.
04Using the pattern and forecast tools in Studio
- 01Open a chart on the daily timeframe.
- 02Turn on Regime bands from Modules to shade the trend.
- 03Open Ask the chart in the sidebar and scroll to Analogues to see the past windows most like now, and what followed each.
- 04Open Analysis and choose Intermarket, under Patterns, to test which markets lead this one.
- 05Open Learned model, under Forecast, to build a line from the inputs you choose.
Anyone can open a chart. Signing in starts a free fourteen-day trial of everything; after that, the free plan keeps the chart and the core tools, and the rest comes with PyraTime Pro.