Price and time, measured from the turn you choose.
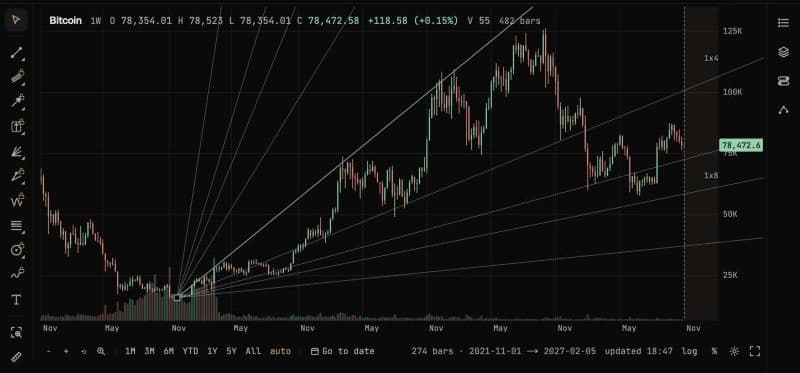
A fan of angles, a box, a wheel of square roots and a ladder of day counts, all started from a high or low you click. They show where to look as time passes. They don't say what price will do there.
Gann fan · Gann box · Range square · Square of 9 · Time counts · Convergence
Who it's for
Traders who already draw Gann angles or Square of 9 levels by hand, and anyone curious what they look like on their own market without a spreadsheet.
What you'll see
Rays at fixed ratios of price to time, a box cut into eighths and thirds, Square of 9 levels a turn apart, and date lines at 30 to 360 days from the turn.
Good to know
In our tests, Gann angles, the Square of 9 and time counts did no better than chance on Bitcoin, and the classic counts did no better on the S&P 500, the Dow or gold. Treat them as a way to organise a chart, not a forecast.
What it helps you do
- 01
Find the 1×1 from a major low
Click the turn, then a point that sets one unit of price per unit of time. Lock price to time (⌥1) keeps it at 45° as you zoom.
- 02
Read Square of 9 levels for today's price
Open the wheel over the chart, or drop Square of 9 levels as a drawing, and see the prices a turn above and below.
- 03
Mark the dates worth watching
Add time counts or a Gann box from the same turn, and every count and division gets its date on the axis.
Free to start, the rest with Pro
Anyone can open a chart without an account. Signing in starts a fourteen-day trial of everything. After that, the free plan keeps the chart and the core tools, and Pro is €19.99 a month or €199 a year.
- Free
- Gann fan, Square of 9 wheel
- Pro
- Gann box, Range square, Square of 9 levels as a drawing, Time counts, Convergence
- Trial
- All of it, for fourteen days from signing in
Questions
01Do I need to know Gann's methods to use these?
No. Each tool asks for one or two clicks on a high or low, and the drawing's details list every level and date it makes. The guide explains what each one measures.
02Do Gann angles predict turns?
Not in our tests. On Bitcoin's daily chart, the angles, Square of 9 levels and time counts did no better than random lines. On decades of S&P 500, Dow and gold data, turns landed on the count dates no more often than on any other dates. Studio's Test button scores a drawing on your own market.
03Which markets and timeframes does it work on?
Any chart in Studio: crypto, indices, futures, forex and stocks. Daily, weekly and monthly bars are free. Intraday bars, on the crypto pairs, come with Pro and the trial.
Try Gann on a real chart
The link opens Studio with Gann on. No account needed to look.