Gann tools, plainly
Four tools that treat price and time as one geometry: a fan of angles, a box, a wheel of square roots and a ladder of day counts. What each one draws, how to place it, and what they did and didn't do when we tested them.
PyraTime7 min readUpdated November 2026
01What it's for
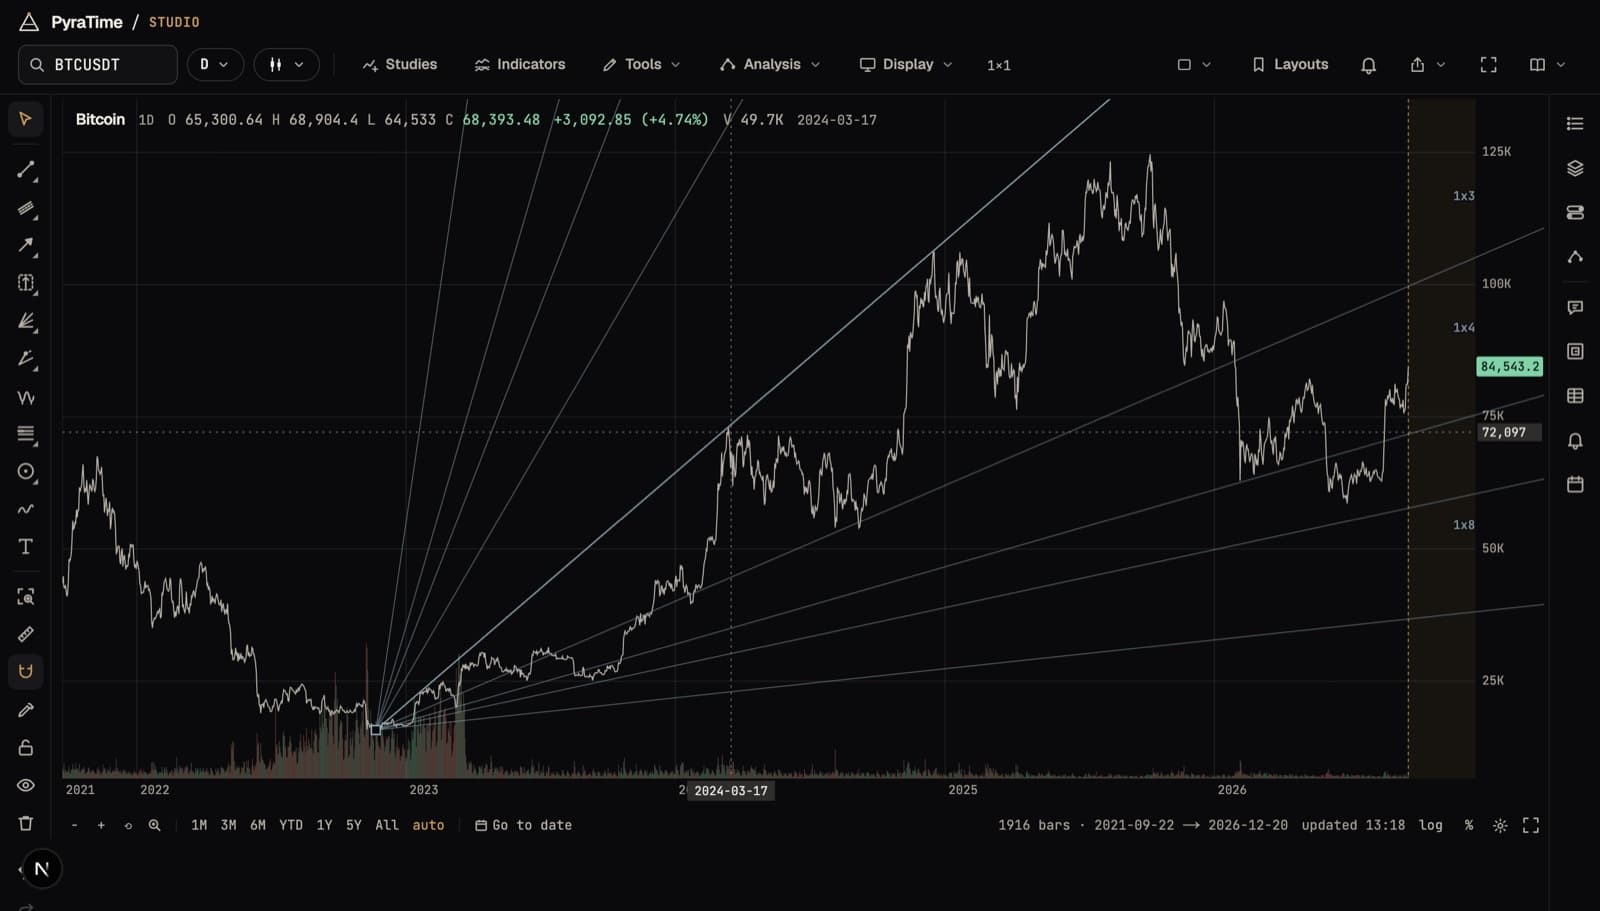
The Gann tools start from one idea: that a move in price and a move in time can be measured against each other. If you decide that one day is worth a fixed number of dollars, a line rising one unit of price for each unit of time is the 1×1, and every other angle is a multiple of it.
The tools then answer two practical questions from a high or low you choose. Where might price find support or resistance as time passes? And on which dates, counted from that turn, should you be paying attention? They don't say what will happen there. They tell you where to look.
02The tools, and what each draws
- Gann fan
- Rays from a high or low at fixed ratios of price to time: 1×1, then 1×2, 2×1, 1×3, 3×1 and so on. Click the pivot, then a point that sets the 1×1. Free for everyone.
- Gann box
- A rectangle from two corners, divided into eighths and thirds in both price and time. Diagonals, angles and circles can be switched on in its settings, and the crossings mark prices and dates inside the move.
- Square of 9
- Levels a turn of the square from a price: take the square root, add or subtract 2 for each full turn, square it again. As a drawing, click a price. As the wheel over the chart, it's free for everyone.
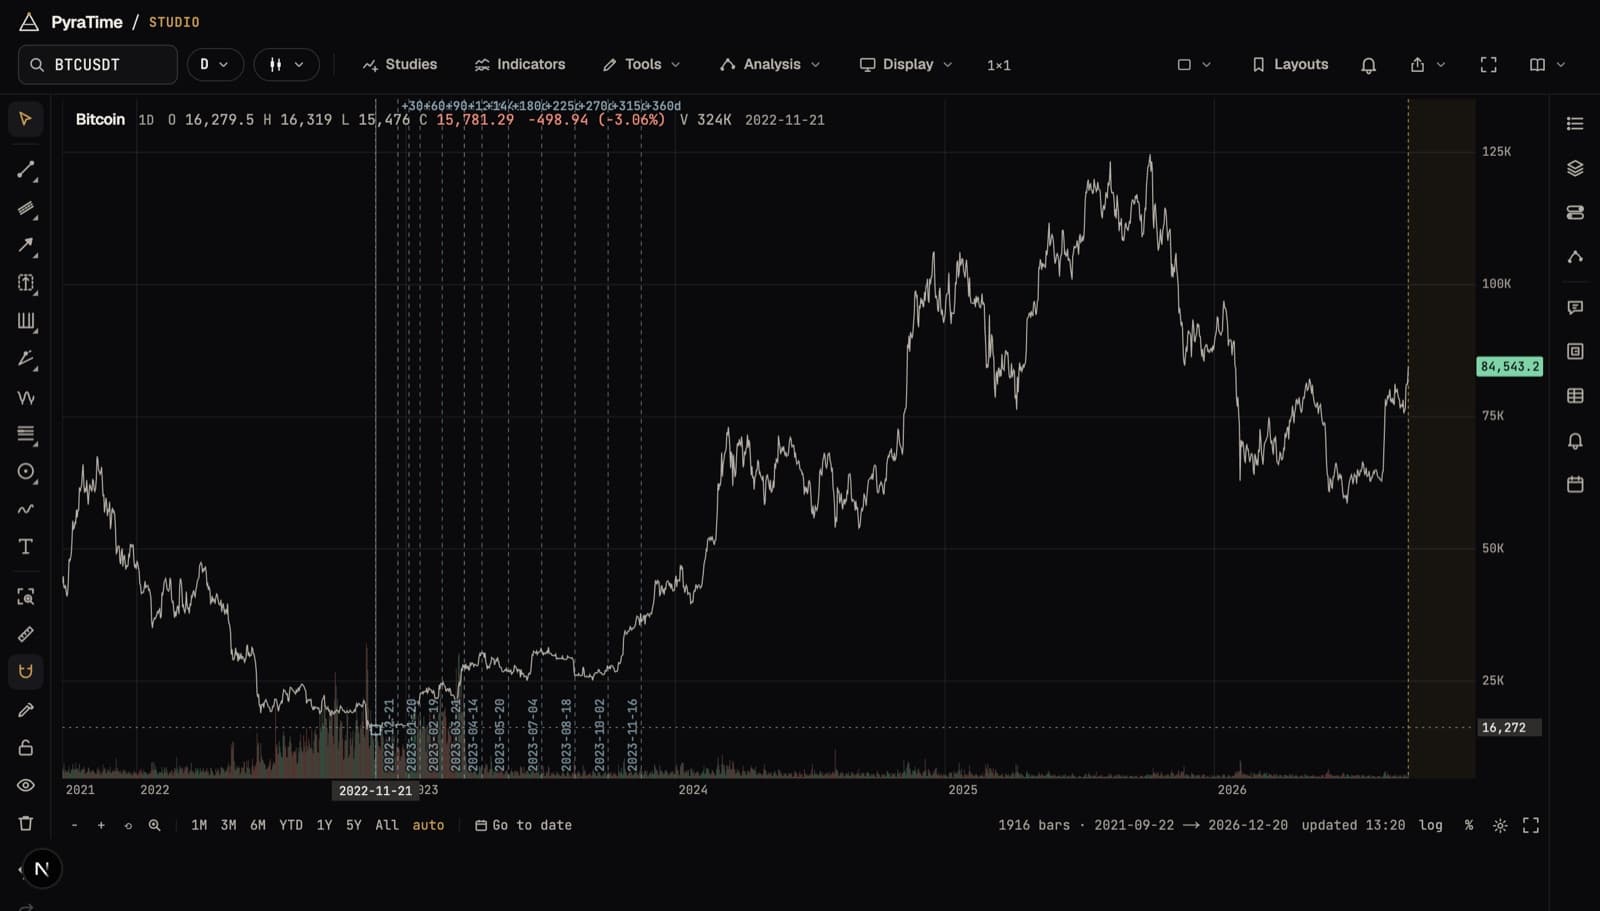
- Time counts
- Date lines at 30, 45, 60, 90, 120, 144, 180, 225, 270, 315 and 360 days from a high or low.
- Lock price to time
- Fixes the chart's scale so the 1×1 stays a true 45° line as you zoom (⌥1). Without it, the angles only look right at one zoom.
03What our tests found
We tested Gann angles, the Square of 9 and three kinds of time count on Bitcoin's daily chart, scoring each against how often price turns near a random set of the same lines. None did better than chance: not on the years used to set them up, and not on the years after.
We then ran the classic time counts (30 to 360 days) from each market's most extreme recent swing on the S&P 500, the Dow and gold, decades of history each. Turns landed on the count dates no more often than on any other dates. On both S&P 500 series, none landed on them at all.
That doesn't make the tools useless. It means they are a way of organising a chart, not a forecast. If you rely on one, test it on your own market and your own anchor: Studio's Test button scores a drawing against chance, and every test you run is counted.
04Using the Gann tools in Studio
- 01Open a chart and pick a market and timeframe.
- 02Turn on the magnet (⌥S) so clicks land on real highs and lows.
- 03Choose the Gann fan (⌥G), click a major low or high, then click the point that sets the 1×1.
- 04Add a Gann box (⌥B) or time counts (⌥N) from the same turn, or open the Square of 9 wheel from the palette (⌘K).
- 05Select a drawing to see its levels and dates, and use Test in its details when you want a score.
Anyone can open a chart. Signing in starts a free fourteen-day trial of everything; after that, the free plan keeps the chart and the core tools, and the rest comes with PyraTime Pro.