Cycles fitted on the past, graded on bars they never saw.
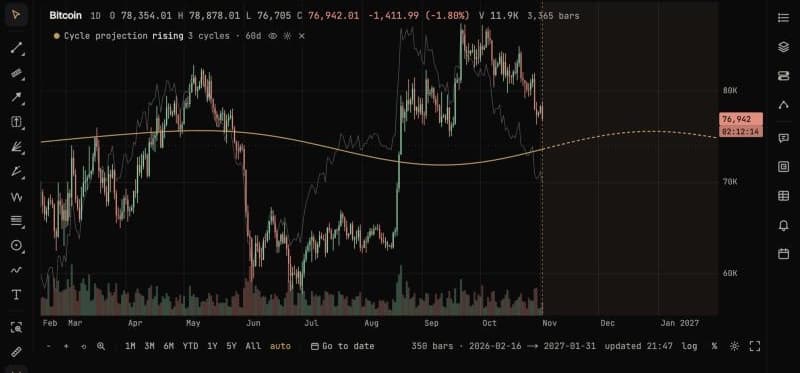
Find the cycle lengths that carry a market's swings, sum them into one line that runs past the last bar, and see how that line did on data it wasn't fitted on, beside what random series score.
Cycle model · Cycle projection · Cycle drawing · Spectrum · Q-Spectrum · Q-Box · Seasonal · Turn bands · Scalogram
Who it's for
Traders who think in cycles and want them fitted, tested and drawn, with an honest answer about whether a cycle has held up out of sample.
What you'll see
A projection line over the chart and into the future zone, the strength of each cycle length, which lengths have forecast on unseen bars, shaded turn windows and how each cycle fades over time.
Good to know
Run forward through decades of the S&P 500, the Dow, gold and Bitcoin, the projection didn't clear the score random series reach. The cycle model shows that floor for your settings, beside the score.
What it helps you do
- 01
Fit a cycle and read the turn bands
Turn on Cycle projection, then open Cycle model to choose how many cycles to fit and see the windows where the line turns.
- 02
Find the lengths that matter
Spectrum shows which cycle lengths carry the most swing. Q-Spectrum shows which of those have actually forecast on bars they weren't fitted on.
- 03
Check a cycle against noise
Every fit is graded on unseen bars and compared with the same procedure on random series, so you can tell a cycle from a coincidence.
Part of PyraTime Pro
Anyone can open a chart without an account. Signing in starts a fourteen-day trial of everything. After that, the free plan keeps the chart and the core tools, and Pro is €19.99 a month or €199 a year.
- Pro
- Cycle model, Cycle projection, Cycle drawing, Spectrum, Q-Spectrum, Q-Box, Seasonal, Turn bands, Scalogram
- Trial
- All of it, for fourteen days from signing in
Questions
01What timeframe do cycles need?
Daily bars. The model fits on the history before a moving border and grades on the bars after it, so the longer the daily history, the more unseen bars there are to grade it on.
02Will the projection tell me where price goes?
No. In our tests it didn't beat the noise floor on any market we tried, and the yearly cycle's timing moved by months between eras. Treat the line as a description of the past that can be checked.
03Can I draw my own cycles?
Yes. Click a trough with the Cycle tool, then the next: that length runs on as a wave, and every cycle you draw adds to one composite.
Try Cycles on a real chart
The link opens Studio with Cycles on. Signing in starts the fourteen-day trial, which unlocks it.