Market cycles
A cycle is a rhythm a market seems to repeat. Studio can find the strongest ones, sum them into a line that runs past the last bar, and test that line on bars it never saw. What each view shows, and how to tell a real rhythm from one that noise would have produced.
PyraTime8 min readUpdated November 2026
01What it's for
Cycle analysis looks for wave lengths in a price history: a swing that has tended to repeat every 60 days, or every year. If such a rhythm is real and stable, adding the strongest ones together gives a line that can be carried into the future to suggest when the next highs and lows are due.
The catch is that every price history contains waves. A random walk has them too, so finding a cycle proves nothing by itself. Studio's cycle tools are built around that: each one fits on older bars, is graded on newer ones, and is compared with what the same procedure scores on random series that have no cycle at all.
02The tools, and what each draws
- Cycle model
- Fits the strongest cycles on the bars before a moving border and grades the line on the bars after it, step by step through the history.
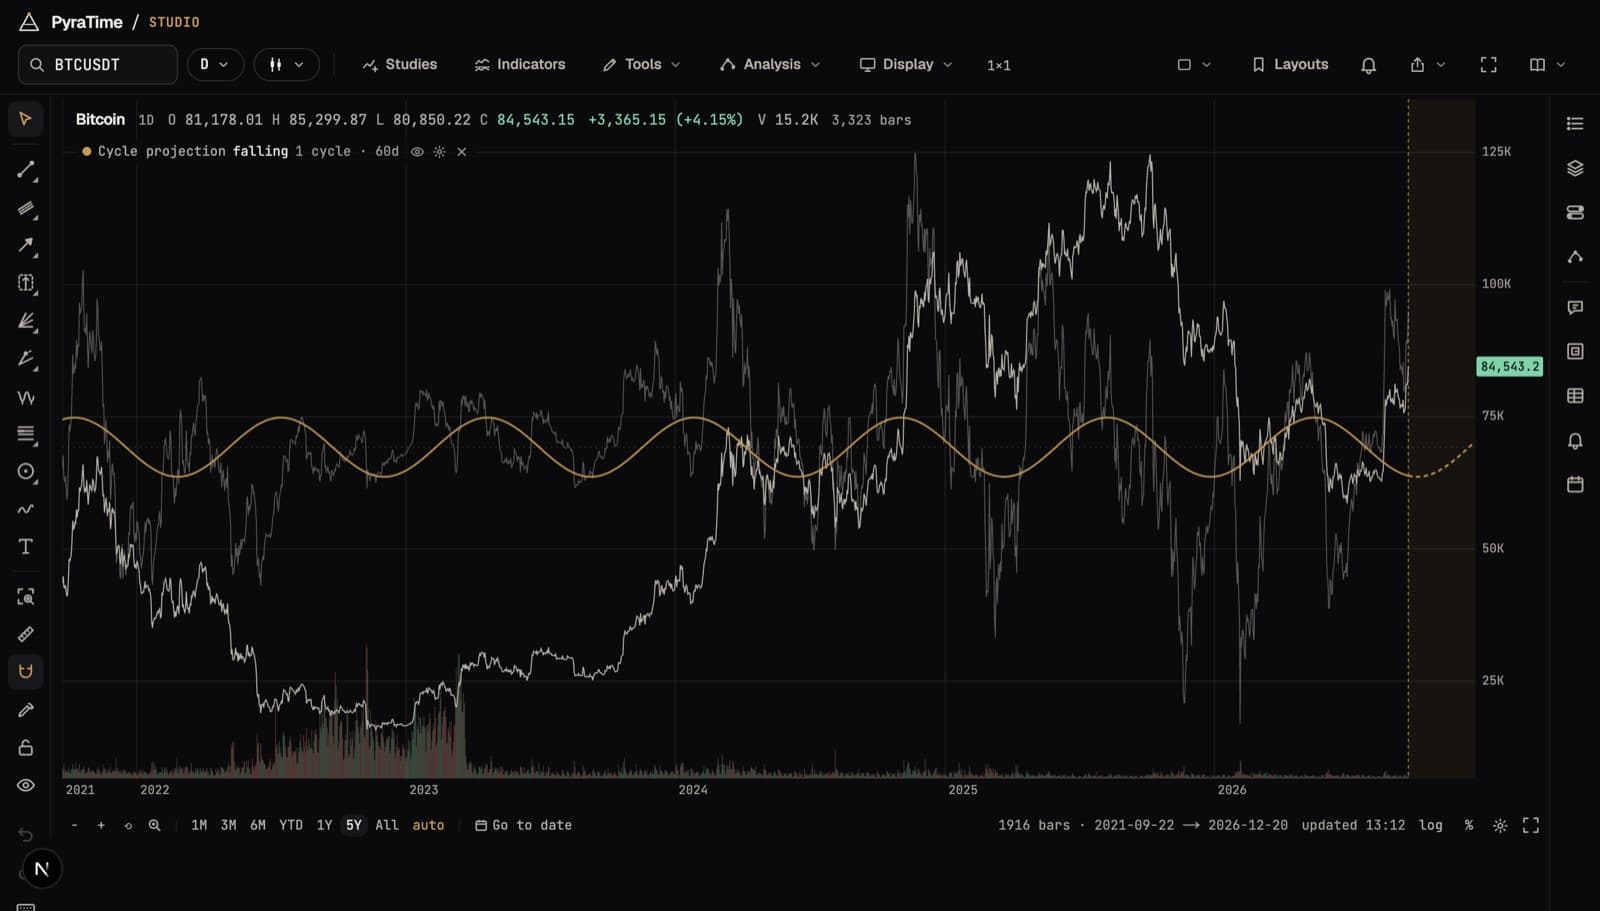
- Cycle projection
- The fitted cycles summed into one line over the chart, carried past the last bar into the future zone.
- Cycle drawing
- Click a trough, then the next: that length runs on as a wave, and every cycle you draw adds to one composite.
- Spectrum
- Which cycle lengths carry the most swing, as a chart of strength against length.
- Q-Spectrum
- Which cycle lengths have actually forecast on bars they weren't fitted on, including cycles that run reliably upside down.
- Q-Box
- Where turns fall inside one cycle: early, at the expected point, or late.
- Seasonal
- How the average year has behaved, slice by slice, with markers where the pattern changed between eras.
- Turn bands and scalogram
- Shaded windows where the projection turns, and a picture of how each cycle's strength rises and fades over time.
03What our tests found
We ran the projection line forward through decades of the S&P 500, the Dow, SPY and gold, and nine years of Bitcoin, and compared each score with what the same procedure scores on random series. None cleared that floor. The S&P's score looks good against zero, which is how cycle scores are usually reported, but random series score nearly as well.
The annual cycle, the most repeated rhythm of all, is there in every market, but its timing doesn't hold still. Fitted era by era, the S&P 500's yearly peak moved by almost three months, and Bitcoin's by five. A cycle whose high you can't place in the calendar can't be traded on.
Scanning sixty cycle lengths from 20 to 500 days, chosen before looking, on Bitcoin, the S&P 500 and gold, found some lengths that ran reliably upside down, but none that survived correcting for the number of lengths tried.
So the cycle model measures that floor for your settings and shows it beside the score, and Studio counts every test you run in Claims. A cycle that clears both is worth attention. One that doesn't is what noise looks like.
04Using the cycle tools in Studio
- 01Open a chart on the daily timeframe; cycles need daily bars.
- 02Turn on Cycle projection from Modules to see the fitted line over the chart.
- 03Open Analysis and choose Cycle model, under Cycles, to change how many cycles are fitted, see how the line did on unseen bars, and measure its noise floor.
- 04Use Spectrum and Q-Spectrum to see which lengths carry the swing, and which of those have forecast.
- 05Draw your own with the Cycle tool: click a trough, then the next.
Anyone can open a chart. Signing in starts a free fourteen-day trial of everything; after that, the free plan keeps the chart and the core tools, and the rest comes with PyraTime Pro.