Planetary lines on price charts
A planetary line takes where a planet is in the sky and turns it into a price. Here is how the line is built, why the same planet can draw two different lines, the settings that move them, and what they can and can't tell you.
PyraTime8 min readUpdated November 2026
01A planet's position as a price
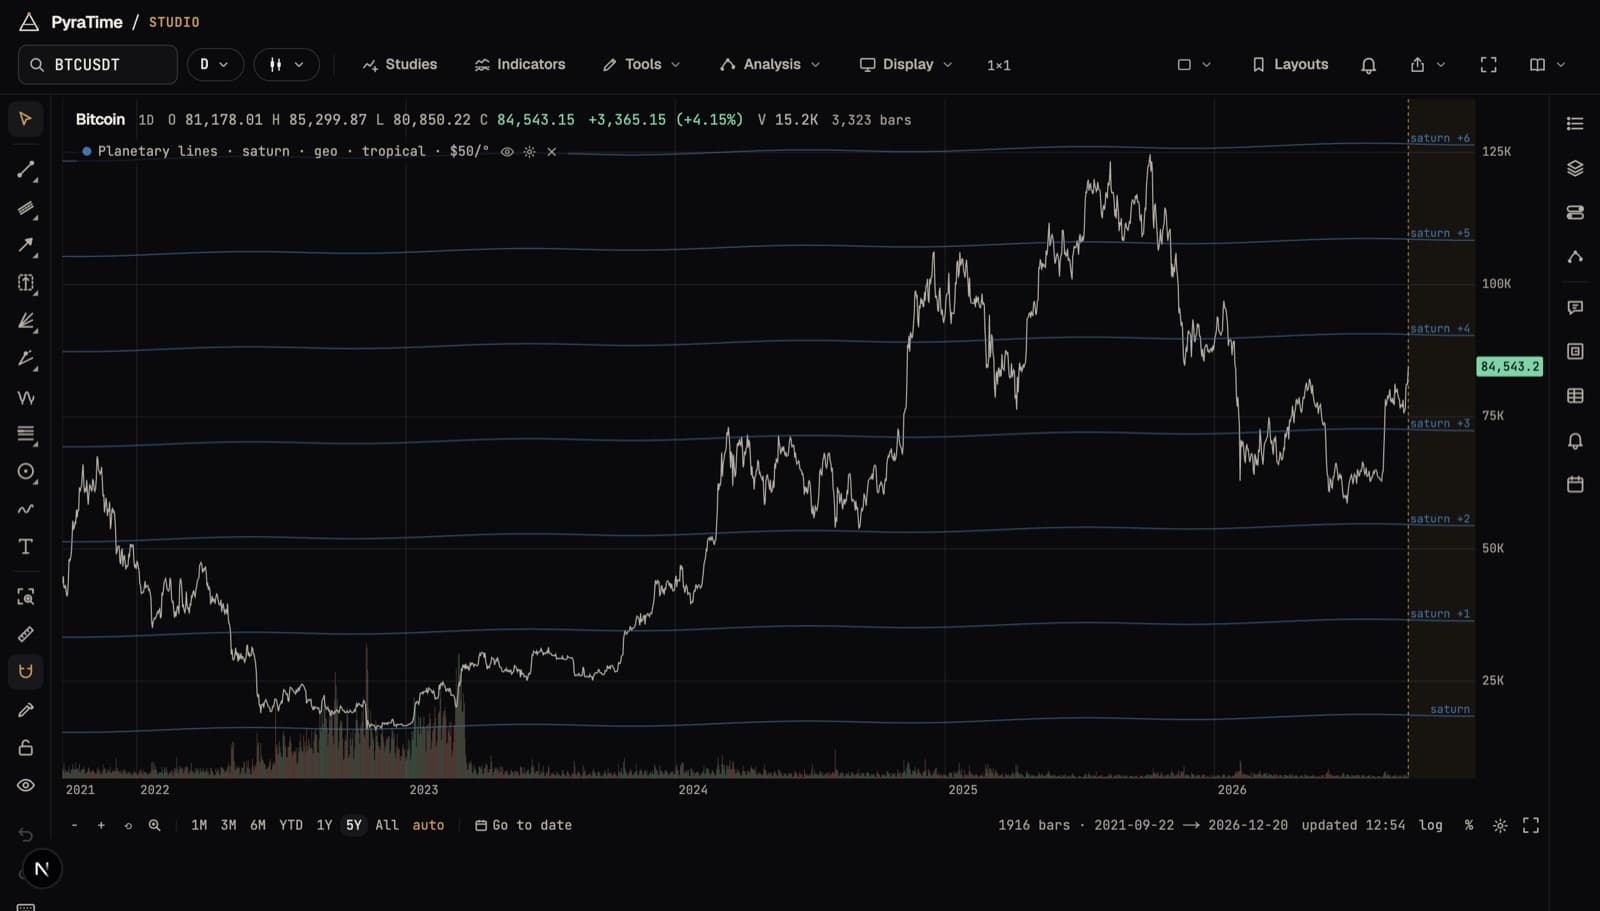
Every planet sits somewhere on a 360° circle around the sky, and it moves along that circle day by day. A planetary line gives each degree a dollar value and draws the result on the price chart. At $50 a degree, a planet at 100° is a line at $5,000; when it reaches 101°, the line is at $5,050.
One full circle at $50 a degree is $18,000, so the same line repeats every $18,000 up the chart: $5,000, $23,000, $41,000 and so on. That family of parallel lines is what you see. Slow planets such as Saturn move about a degree a month, so their lines are nearly flat. Fast ones such as Mars or the Sun climb steeply.
02Seen from the Earth or the Sun
A planet's position depends on where you stand to measure it. Seen from the Earth (geocentric), the planets now and then appear to stop and run backwards for a few weeks: retrograde. The line follows them, so a geocentric line has small bends and loops where the planet turned around.
Seen from the Sun (heliocentric), every planet moves steadily forward, and its line is smooth. The Sun itself, the Moon and the Moon's node only make sense seen from the Earth, so they have no heliocentric line. Neither view is the “right” one. They are two different questions, and it is worth knowing which one a chart is answering.
03The settings that move the lines
The planet decides the shape of the line. Everything else is a choice, and each choice moves where the lines fall:
- Dollars per degree
- How much price one degree of the planet's movement is worth. It sets how far apart the lines are and how steep they look.
- Offset
- Slides every line up or down by the same amount. “Anchor to a pivot” sets it for you, so one line passes through a high or low you click.
- Lines every
- Draws extra lines between the main ones: every 360°, or every 180°, 120°, 90°, 60°, 45° or 30° of the planet's travel.
- Seen from
- The Earth (geocentric) or the Sun (heliocentric).
- Zodiac
- Tropical, measured from the spring equinox, or sidereal, measured against the fixed stars. The two differ by about 24° today, which slides every line.
- With
- A second planet. Its position is added to the first, or taken away from it, and the lines follow the combined angle.
Dollars per degree and the offset matter most, and there is no single right value for either. That is the most important thing to understand about planetary lines, and it is the subject of the next section.
04What a line can and can't tell you
A planetary line is exact about the planet. Studio reads positions from NASA JPL's DE440 ephemeris, so the line is where the planet really was and will be (see How exact are the planets on your chart?). What the line is not is evidence that the planet moves the price.
Two settings are free to choose, and both change where the lines fall. Pick the offset by clicking a high, and one line passes through that high by construction. Add lines every 30° at $50 a degree and they are only $1,500 apart. On a $80,000 chart, price is never more than about 1% from one of them. Touches like these are guaranteed, not found.
So the honest question is narrower: do turns land on these lines more often than on the same lines slid to a random height? Studio asks exactly that when you press Score these lines. It compares the hit rate with the same lines at random offsets, and it reports how much of the chart the lines cover. That way, a set dense enough to touch everything says so. The score is opt-in, and every score you run is kept in your Claims list, so the bar for the next one rises with each test.
We don't publish a general verdict on planetary lines, because there isn't one line to test: every planet, scale, offset and market is its own claim. Use the score on the line you actually mean to rely on, and decide the settings before you look at how well they fit.
05Drawing them in Studio
- 01Open a chart, then open Analysis and choose Planet lines, under Price levels.
- 02Pick a planet, or start from a preset such as Saturn at $50 a degree.
- 03Set dollars per degree with the slider, and choose Earth or Sun, and tropical or sidereal.
- 04Press “Anchor to a pivot on the chart” and click a high or low to set the offset.
- 05When you want to know whether the line earns its place, press Score these lines.
Up to four sets of lines can be on the chart at once, each in its own colour, and the lines run on into the future zone, past the last bar.