Astro on a price chart
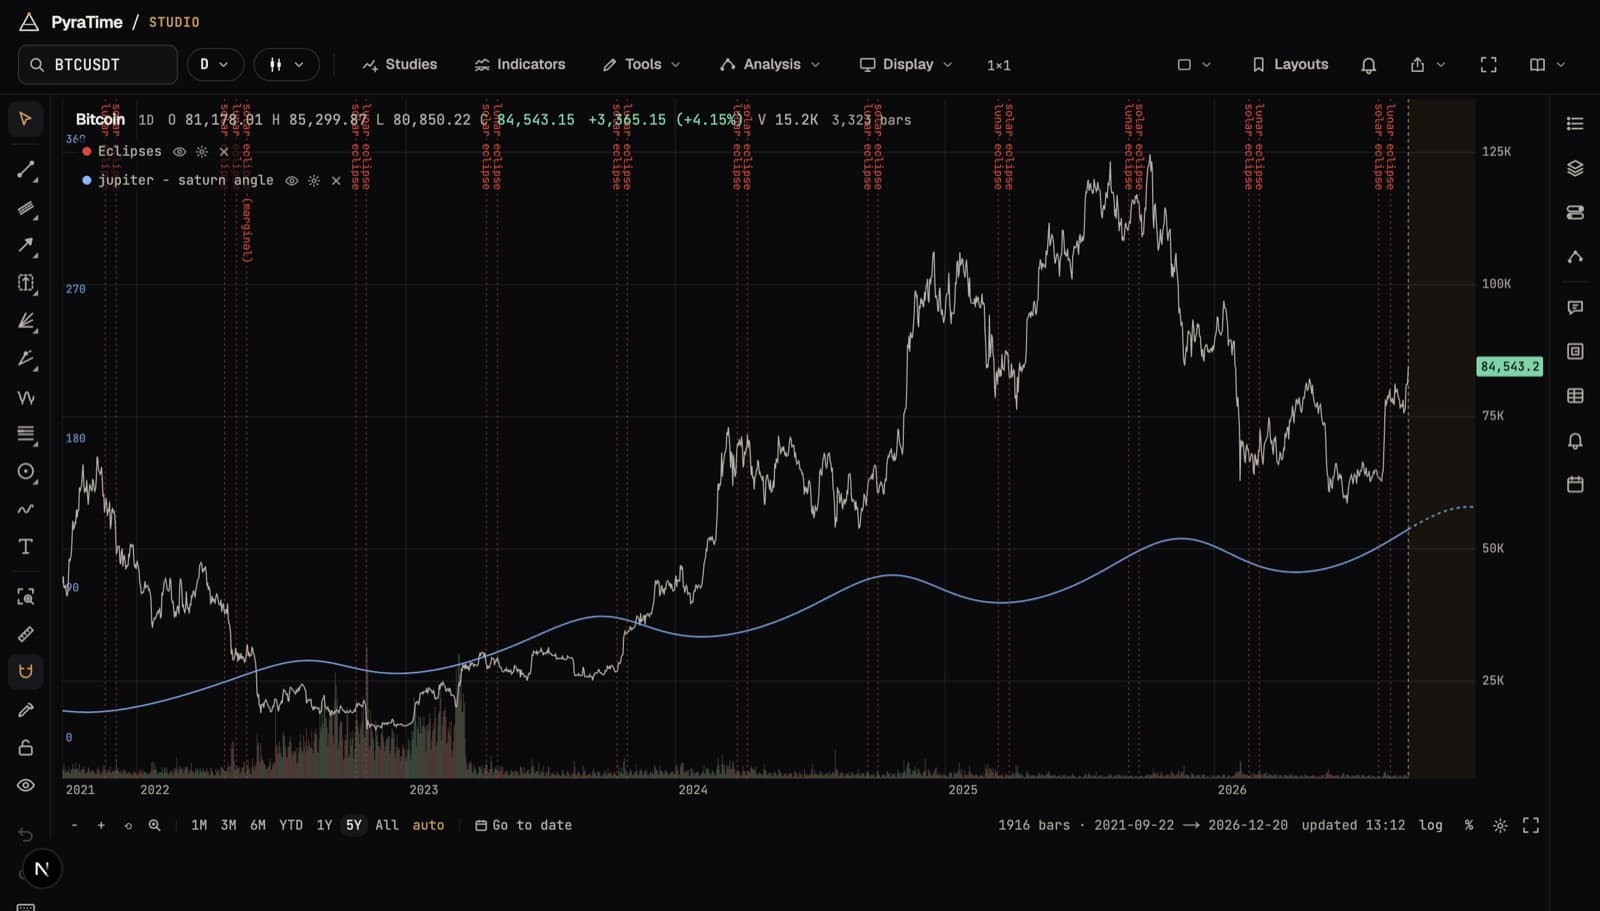
The sky as data beside the price: dated events marked on the chart, planets turned into price lines, angles drawn as curves, and the whole sky on any date. What each tool draws, how exact it is, and what it can and can't tell you.
PyraTime7 min readUpdated November 2026
01What it's for
Astro tools put astronomical facts on the same chart as price: when an eclipse fell, when two planets were 90° apart, when a planet appeared to stand still. Whether those moments matter to a market is a separate question. The tools' first job is to get the facts right and show them clearly.
Every position in Studio comes from NASA JPL's DE440 ephemeris, the same reference used to navigate spacecraft, so an event's time is right to the minute, not the day. That matters most for the Moon, which moves about 13° a day: a shortcut formula a degree out puts a lunar event two hours early or late.
02The tools, and what each draws
- Events
- Marks dated events on the chart as vertical lines: eclipses, lunar phases, aspects between two planets, stations, ingresses, seasons, declination and parallels, and more. Pick a family and the planets it needs.
- Planet lines
- Turns a planet's position into a price at a chosen number of dollars per degree, drawn across the chart and into the future.
- Strips
- Draws a planet angle, such as the angle between Jupiter and Saturn, as a curve on its own 0–360° scale, under or over the price.
- Sky wheel
- The zodiac on any date you choose: where every planet is, and the angles between them.
- Astro seasonal
- Splits a planetary cycle into slices and shows the market's average return in each.
- Coming up
- A list of the events ahead with exact times. Click one to scroll the chart there.
- Ascendant clock
- On intraday charts: from a high or low to the minute, marks when the Ascendant has travelled set distances, for a chosen place on Earth.
03What our tests found
We don't have a general verdict on astro, because there isn't one claim to test: every planet, aspect, orb and market is its own question, and a chart with enough events will always show some near turns.
Where we have tested a specific claim, it hasn't held. The Ascendant clock's marks, scored on years of one-minute Bitcoin, XRP and gold-proxy bars against the same marks shifted by whole days, found no lead on any of the three markets. Casting the Ascendant and Midheaven for eight places (seven cities, and a control at 0° latitude and longitude) did no better: of 528 combinations, 32 reached the usual 5% level, about the 26 expected by chance, and none survived correcting for the search.
If an event or line matters to you, test it on its own. Studio scores planet lines against the same lines at random offsets, and every test you run is kept in Claims.
04Using the astro tools in Studio
- 01Open a chart, then open Analysis and choose Events, under Astro.
- 02Pick a family, such as eclipses or aspects, and the planets it needs. The events appear as marks on the chart.
- 03Add a strip for a planet angle, or planet lines (under Price levels) for price as a planet's position.
- 04Open Coming up in the sidebar for the next events with exact times.
- 05Open the Sky wheel to see the whole sky on any date.
Anyone can open a chart. Signing in starts a free fourteen-day trial of everything; after that, the free plan keeps the chart and the core tools, and the rest comes with PyraTime Pro.