Picking an anchor
A fan, a box, a time count or a planet line is only as meaningful as the point it starts from. Move that point and every line moves with it. Here is how to choose one, and how not to fool yourself with it.
PyraTime6 min readUpdated November 2026
01Every tool starts from a point
The geometry in Gann and price–time work is fixed: a 1×1 angle is a 1×1 angle, and 90 days is 90 days. What isn't fixed is where you put it. That starting point is the anchor, and almost every tool needs one:
- Gann fan
- A high or low, then a second point that sets the 1×1.
- Gann box
- Two corners, usually a low and the high that followed.
- Time counts
- One high or low; the counts run forward from its date.
- Square of 9
- A price, usually a major high or low.
- Arc
- The major low, then the first strong high after it.
- Planetary lines
- The offset, set by clicking a high or low.
The tool does the arithmetic. The anchor is the one decision you make, and it decides everything the tool draws afterwards.
02Same tool, two anchors
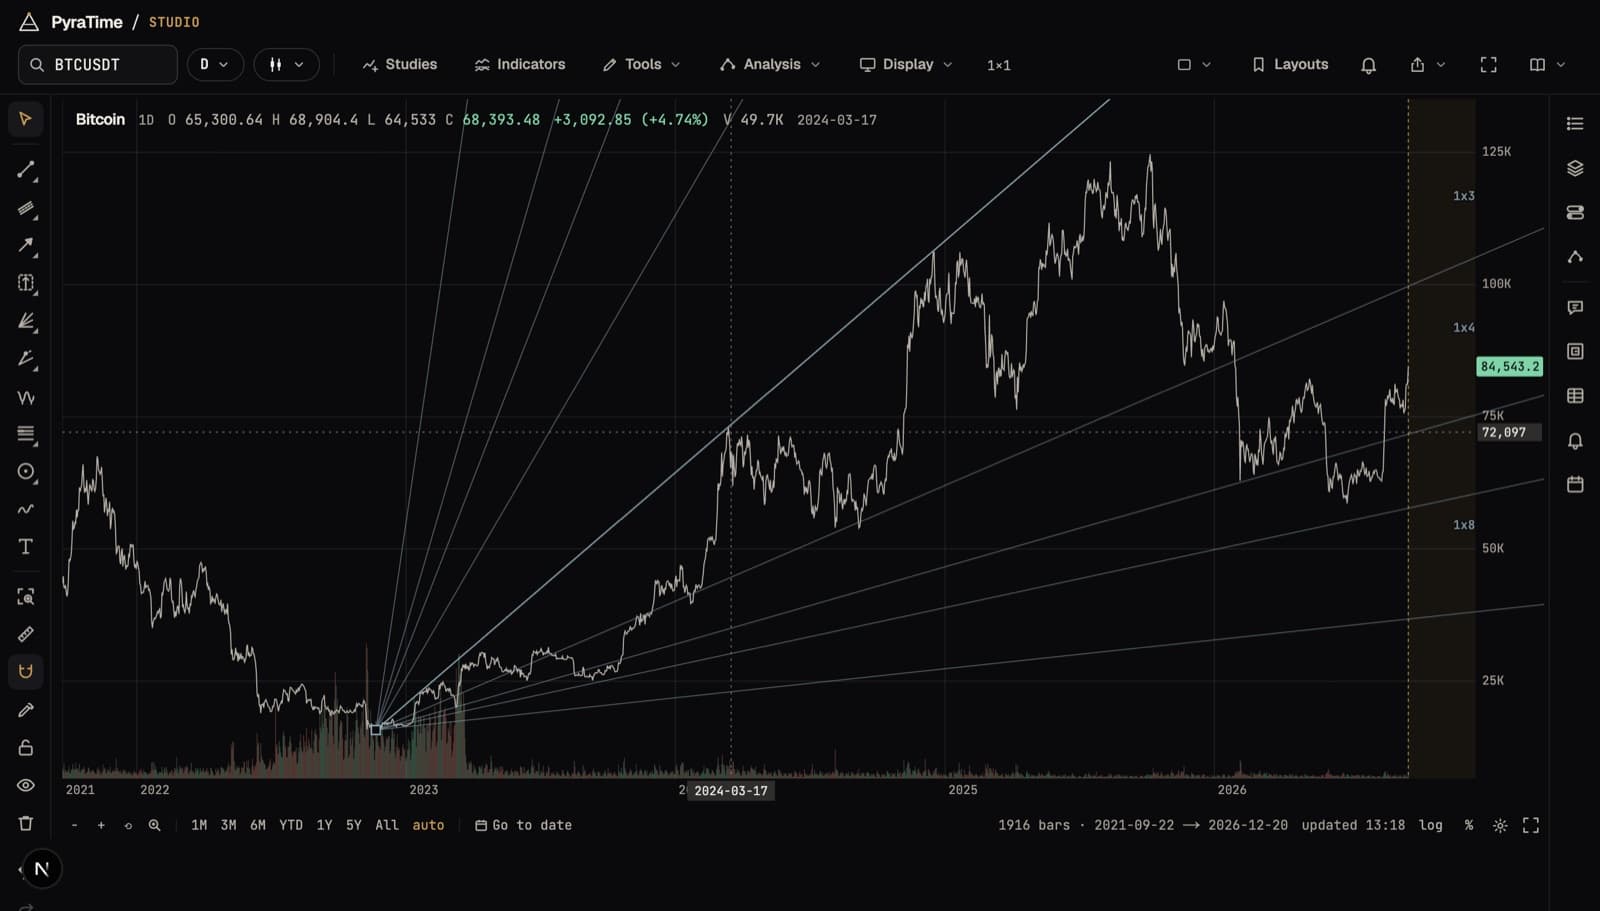
Here is the same Gann fan on the same Bitcoin chart, twice. The first starts from the November 2022 low, the bottom of the bear market, with its 1×1 set through the March 2024 high.
The second starts from the August 2024 low, a pullback inside the rally, with its 1×1 through the December 2024 high.
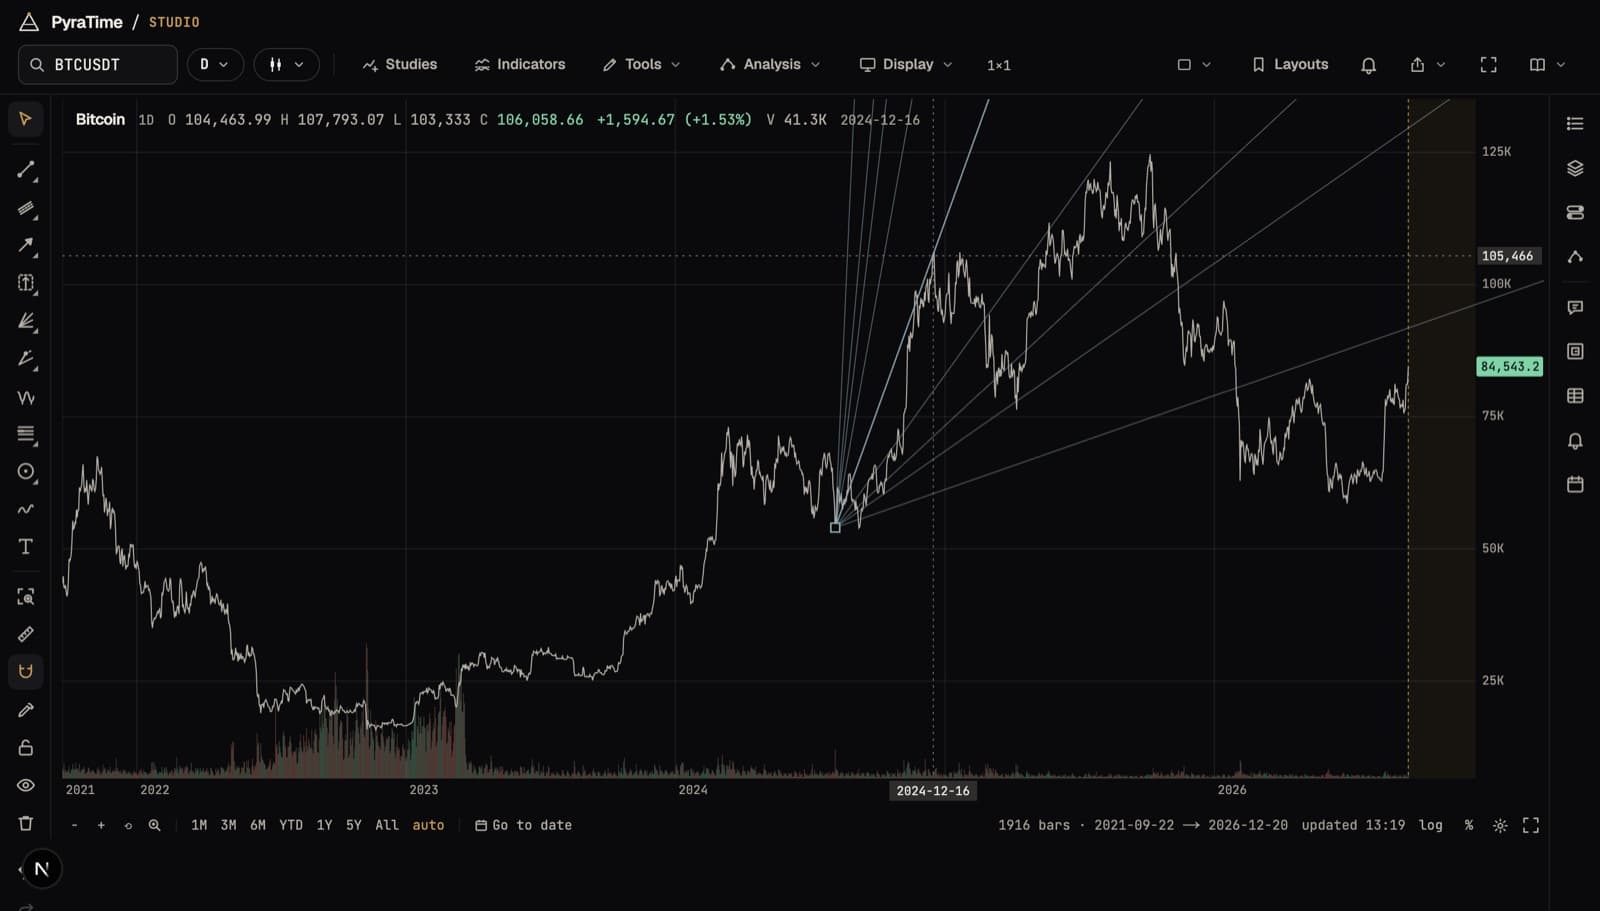
Both are “correct” Gann fans. They disagree about almost every level and date on the chart, because they answer different questions: one is about the whole move from the 2022 bottom, the other about one leg of it. Neither is wrong. What would be wrong is drawing both, then keeping whichever one price happened to respect.
03What makes a good anchor
A good anchor is one you would have chosen without looking at what came after it. In practice that means:
- A real turn, not a wiggle. A high or low that stands out on the timeframe you are working on: the start of a trend, the end of one, a level the market clearly reversed from.
- The right size for the question. A multi-year low for a multi-year projection; a swing of a few weeks for the next few weeks. A fan from a minor low says little about next year.
- Chosen by a rule you can repeat. “The lowest close of the last bear market” or “the last swing of 20% or more” can be applied the same way on any chart. “The one that lines up nicely” can't.
- Written down before you look forward. Pick the anchor, note why, and only then study what the tool says about later prices and dates.
04The trap: trying anchors until one fits
Every chart has dozens of highs and lows. Try enough of them and one will always produce a fan, a count or a planet line that price respected beautifully. That isn't a discovery; it is what searching does. The more anchors you try, the better the best one will look, whether or not anything is there.
We ran into this ourselves. When we tested yearly time counts from swing anchors on Bitcoin, they beat chance when the anchors were picked from 20% swings, but not from 25% or 30% swings, and not in the years before 2022. One setting out of three, in one era out of two, is what a lucky search looks like. We don't count it as a finding.
There is a quieter version of the same trap. An anchor is a turn, so a test that scores a tool against turns will find that the tool “hits” its own anchor every time. In our early tests on Bitcoin, every scored turn was also an anchor, and the results looked better than they were. Studio now leaves out the turns a drawing was placed on when it scores that drawing.
None of this means anchoring is arbitrary. It means the anchor should come from a rule, and that the rule should be tried on more than one market or era before you trust it.
05Anchors in Studio
- The magnet (⌥S, on by default) snaps every click to the nearest swing high or low, so an anchor lands on the actual turn, not a pixel beside it.
- Last major swing, in the Price–Time panel, finds the most recent swing of a set size for you, by a fixed rule, and lays out the angles, arc and year counts from it in one click.
- Moving an anchor is a drag. Every line follows it, so you can see at once how much a tool depends on where it starts.
- Testing is a button in the drawing's details. Every test you run is kept in Claims, so trying ten anchors costs ten tests, and the bar for the next result rises with each one.